andrey-tech / nginx-unit-log-analyzer-php
Tool to analyze NGINX Unit log file in console
Installs: 2 699
Dependents: 0
Suggesters: 0
Security: 0
Stars: 0
Watchers: 1
Forks: 0
Open Issues: 0
pkg:composer/andrey-tech/nginx-unit-log-analyzer-php
Requires
- php: ^8.1
- symfony/console: ^5.4 || ^6.4 || ^7.1
- symfony/yaml: ^5.4 || ^6.4 || ^7.1
Requires (Dev)
- andrey-tech/pdepend-summary-formatter-php: ^1.2
- dg/bypass-finals: ^1.4
- overtrue/phplint: ^9.0
- pdepend/pdepend: ^2.16
- phpmd/phpmd: ^2.14
- phpunit/phpunit: ^10.5
- slevomat/coding-standard: ^8.15
- squizlabs/php_codesniffer: ^3.10
- vimeo/psalm: ^5.24
This package is auto-updated.
Last update: 2025-12-04 19:34:02 UTC
README
Russian version (русскоязычная версия)
The NGINX Unit Log Analyzer is a utility for analyzing log files from the NGINX Unit application server. It examines the execution durations of NGINX Unit processes for deployed applications with a precision of one second, generating various types of reports in either tabular or graphical formats.
Contents
Installation
The NGINX Unit Log Analyzer requires:
To install via Composer:
composer require --dev andrey-tech/nginx-unit-log-analyzer-php
To install GNU Plot using APT (Advanced Package Tool):
apt install gnuplot
Command Line Arguments and Options
./vendor/bin/nginx-unit-log-analyzer [OPTIONS] <log_file>
Where:
[OPTIONS] are the command line options,
<log_file> is the path to the NGINX Unit log file containing information about application processes, formatted as:
2024/06/13 13:31:06 [info] 657#657 "application-3" application started
2024/06/13 13:32:14 [notice] 151#151 app process 657 exited with code 0
Command Line Options
| Option | Description | Value | Default | Example Usage |
|---|---|---|---|---|
--log-timezone |
Log file timezone | Timezone name | Script's timezone | --log-timezone Europe/Moscow |
--report-type |
Type of report to generate | day, top, graph |
graph |
--report-type day |
--report-timezone |
Report timezone | Timezone name | Script's timezone | --report-timezone Europe/Moscow |
--filter-start-time-from |
Filter log entries by start time (from) | Date and time string | — | --filter-start-time-from 2024-06-17 00:00:00 UTC |
--filter-start-time-to |
Filter log entries by start time (to) | Date and time string | — | --filter-start-time-to 2024-06-17 23:59:59 UTC |
--filter-application-name |
Filter log entries by application name | Application name | — | --filter-application-name application-1 |
--graph-file-name |
Filename for graph report type |
Filename | unit.png |
--graph-file-name unit.png |
--graph-types |
Types of graphs for graph report |
quantity, median, average, maximum, minimum |
quantity, maximum, median |
--graph-types quantity --graph-types median |
--no-color |
Disable colored output in console | — | — | --no-color |
Types of Generated Reports
The NGINX Unit Log Analyzer can generate three types of reports (the --report-type option):
day— Execution durations of NGINX Unit processes for deployed applications, averaged over one hour and grouped by day.top— A top list of the longest and shortest NGINX Unit process executions for deployed applications, grouped by day.graph(default) — Graphs of NGINX Unit process execution durations for deployed applications, averaged over one hour.
The day and top reports are generated in the console in tabular form.
The graph report is generated as a graphical file in PNG format and requires the GNU Plot utility for its creation.
The graph report can include the following types of graphs (--graph-types):
quantity(default) — A graph showing the number of NGINX Unit processes for deployed applications, averaged per hour.average(default) — A graph of the arithmetic mean execution duration of NGINX Unit processes for deployed applications, averaged per hour.median— A graph of the median execution duration of NGINX Unit processes for deployed applications, averaged per hour.maximum— A graph of the maximum execution duration of NGINX Unit processes for deployed applications, averaged per hour.minimum— A graph of the minimum execution duration of NGINX Unit processes for deployed applications, averaged per hour.
Report Type day
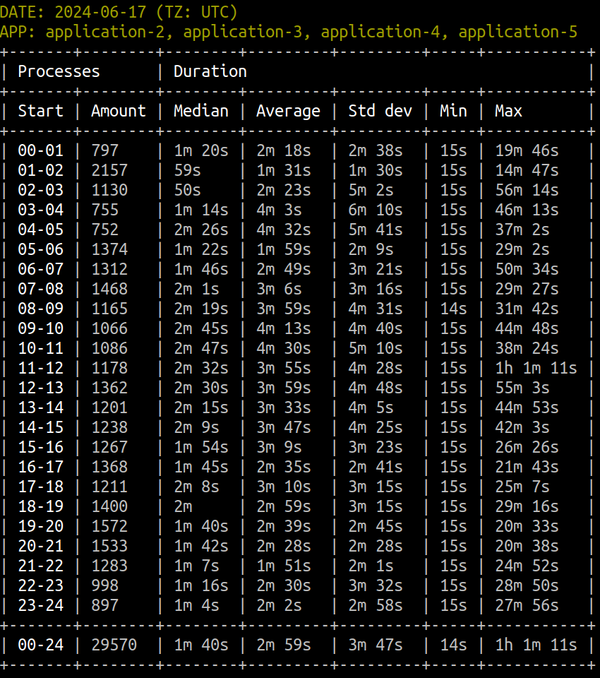
A sample day report fragment for one day:
In the report table:
DATE— the analyzed date with timezone information;APP— a list of application names that were launched during the analyzed date;Processes— information about launched NGINX Unit processes:Start— the analyzed time interval, hours (from-to);Amount— the number of processes launched during the time interval (+n— number of unfinished processes);
Duration— information about the execution duration of processes during the time interval:Median— median value;Average— arithmetic mean value;Std dev— standard deviation of duration;Min— minimum value;Max— maximum value.
The duration values for the execution of NGINX Unit processes in the table are in the format:
d h m s, where: d — days, h — hours, m — minutes, s — seconds.
Report Type top
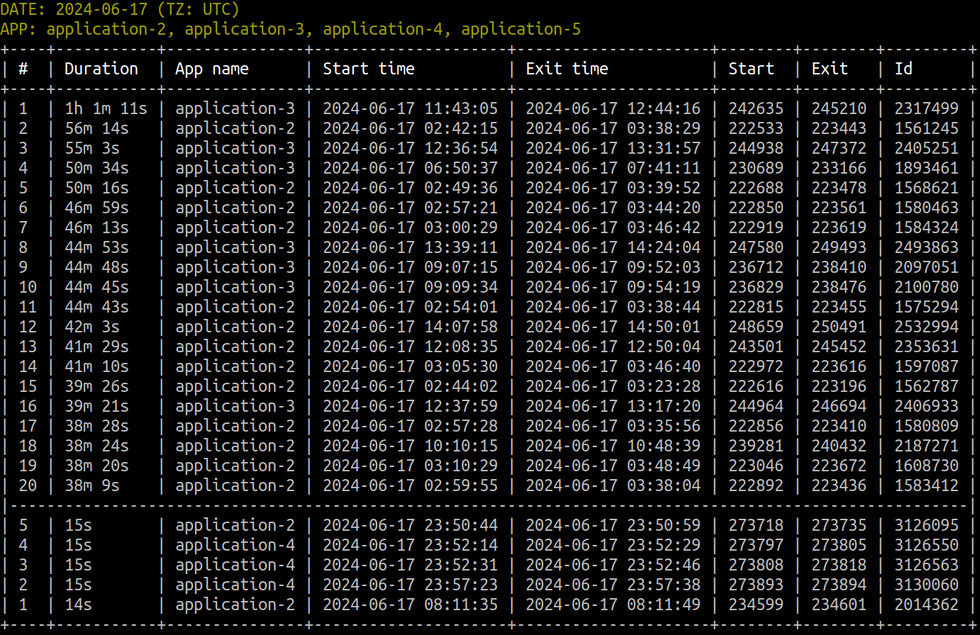
Example fragment of a top report for a single day:
In the report table:
DATE— the analyzed date with timezone information;APP— a list of application names that were launched during the analyzed date;Duration— the duration of the process execution;App name— the application name;Start time— the date and time when the process was started;Exit time— the date and time when the process finished;Start— the line number in the NGINX Unit log file where the process start was recorded;End— the line number in the NGINX Unit log file where the process exit was recorded;Id— the process identifier in NGINX Unit.
At the top of the table, there is a list of the 20 longest-running processes recorded during the analyzed date.
At the bottom of the table, there is a list of the 5 shortest-running processes recorded during the analyzed date.
The lists are sorted in descending order of duration.
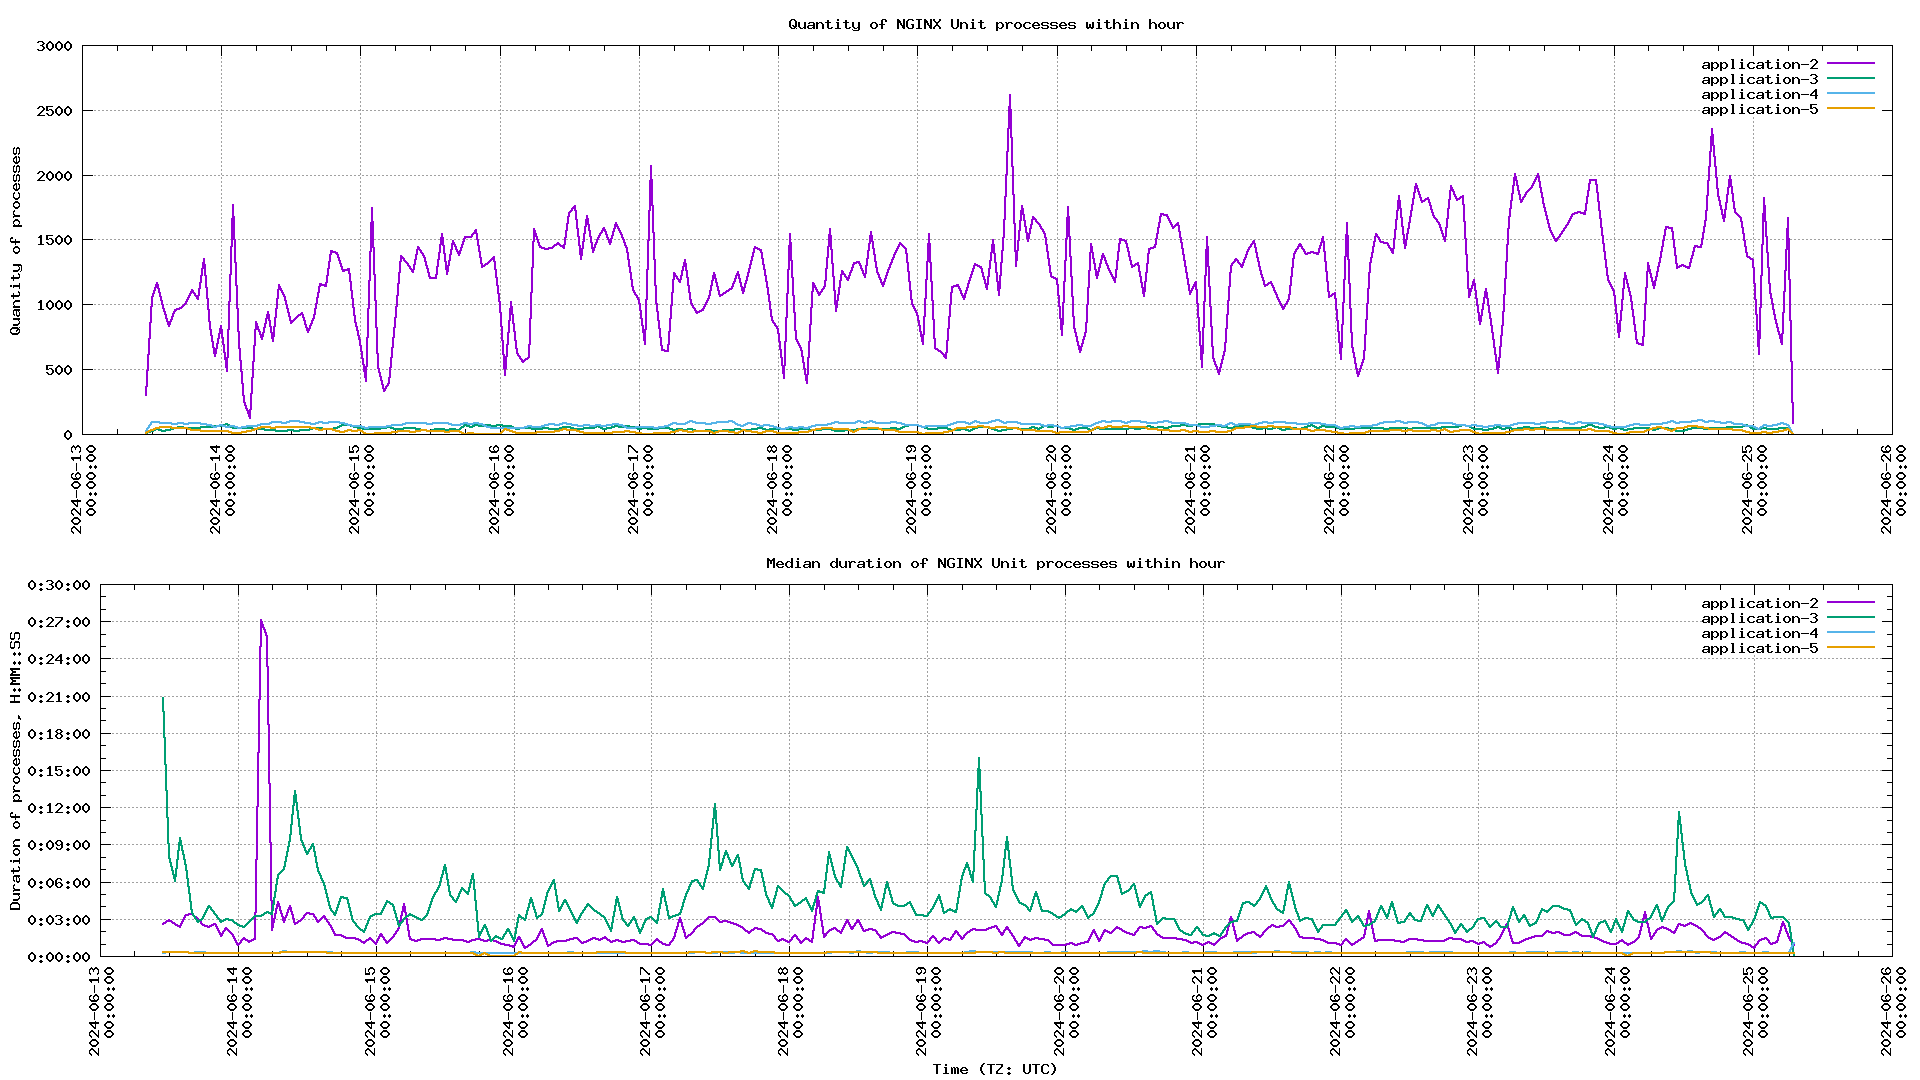
Report Type graph
Example of a graph report, including 2 graphs:
- A graph showing the number of NGINX Unit processes for launched applications, averaged per hour;
- A graph showing the median process execution duration.
The format of the process execution duration values on the graph is:
H:MM:SS, where: H — hours, MM — minutes, SS — seconds.
Authors
© 2024-2025 andrey-tech
License
This library is distributed under the MIT license.
NGINX Unit log analyzer
NGINX Unit log analyzer — это утилита для анализа лог-файлов сервера приложений NGINX Unit. Утилита анализирует продолжительность исполнения процессов NGINX Unit для запущенных приложений с точностью в одну секунду и формирует в консоли отчёты различных типов в табличной или графической форме.
Содержание
Установка
NGINX Unit log analyzer требует:
composer require --dev andrey-tech/nginx-unit-log-analyzer-php
Установка GNU Plot с помощью APT (Advanced Package Tool):
apt install gnuplot
Аргументы и опции командной строки
./vendor/bin/nginx-unit-log-analyzer <NGINX Unit log file> [OPTIONS]
где:
[OPTIONS]— опции командной строки,<NGINX Unit log file>— путь к лог-файлу NGINX Unit, содержащему информацию о запущенных процессах приложений вида:
2024/06/13 13:31:06 [info] 657#657 "application-3" application started
2024/06/13 13:32:14 [notice] 151#151 app process 657 exited with code 0
Опции командной строки
| Опция | Описание | Значение | По умолчанию | Пример использования |
|---|---|---|---|---|
--log-timezone |
Часовой пояс лог-файла | Имя часового пояса | Часовой пояс скрипта | --log-timezone Europe/Moscow |
--report-type |
Тип формируемого отчёта | day, top, graph |
graph |
--report-type day |
--report-timezone |
Часовой пояс отчёта | Имя часового пояса | Часовой пояс скрипта | --report-timezone Europe/Moscow |
--filter-start-time-from |
Фильтр записей лога по времени, от | Строка даты и времени | — | --filter-start-time-from 2024-06-17 00:00:00 UTC |
--filter-start-time-to |
Фильтр записей лога по времени, до | Строка даты и времени | — | --filter-start-time-to 2024-06-17 23:59:59 UTC |
--filter-application-name |
Фильтр записей лога по приложению | Имя приложения | — | --filter-application-name application-1 |
--graph-file-name |
Имя файла графиков для отчёта типа graph |
Имя файла | <NGINX Unit log file>.png |
--graph-file-name unit.png |
--graph-types |
Типы графиков для отчёта graph |
quantity, median, average, maximum, minimum |
quantity, maximum и median |
--graph-types quantity --graph-types median |
--no-color |
Отключение цветов в консоли | — | — | --no-color |
Типы формируемых отчётов
Утилита NGINX Unit log analyzer может формировать отчёты трех типов (--report-type):
day— продолжительность исполнения процессов NGINX Unit для запущенных приложений с усреднением за один час и разбиением по дням;top— топ-лист наиболее и наименее продолжительных процессов NGINX Unit для запущенных приложений с разбиением по дням;graph(по умолчанию) — графики продолжительности исполнения процессов NGINX Unit для запущенных приложений с усреднением за один час.
Отчёты типа day и top формируется в консоли в табличной форме.
Отчёт типа graph формируется в графическом файле формата PNG
и требует для своего создания утилиту GNU Plot.
Отчёт типа graph может включать следующие виды графиков (--graph-types):
quantity(по умолчанию) — график количества процессов NGINX Unit для запущенных приложений с усреднением за один час;average(по умолчанию) — график среднеарифметической продолжительности исполнения процессов NGINX Unit для запущенных приложений с усреднением за один час;median— график медианной продолжительности исполнения процессов NGINX Unit для запущенных приложений с усреднением за один час;maximum— график максимальной продолжительности исполнения процессов NGINX Unit для запущенных приложений с усреднением за один час;minimum— график минимальной продолжительности исполнения процессов NGINX Unit для запущенных приложений с усреднением за один час.
Отчёт типа day
Пример фрагмента отчёта типа day для одного дня:
В таблице отчёта:
DATE— анализируемая дата с указанием часового пояса;APP— список имён приложений, которые были запущены за анализируемую дату;Processes— информация о запущенных процессах NGINX Unit:Start— анализируемый интервал времени, часы (от-до);Amount— количество процессов, которые были запущены в течение интервала времени (+n— число незавершённых процессов);
Duration— информация о продолжительности исполнения процессов в течение временного интервала:Median— медианное значение;Average— среднеарифметическое значение;Std dev— среднеквадратическое отклонение продолжительности;Min— минимальное значение;Max— максимальное значение.
Формат значений продолжительности исполнения процессов NGINX Unit в таблице имеет вид:
d h m s, где: d — дни, h — часы, m — минуты, s — секунды.
Отчёт типа top
Пример фрагмента отчёта типа top для одного дня:
В таблице отчёта:
DATE— анализируемая дата с указанием часового пояса;APP— список имён приложений, которые были запущены за анализируемую дату;Duration— продолжительность исполнения процесса;App name— имя приложения;Start time— дата и время запуска процесса;Exit time— дата и время завершения процесса;Start— номер строки в лог-файле NGINX Unit, в которой был зафиксирован запуск процесса;End— номер строки в лог-файле NGINX Unit, в которой было зафиксировано завершение процесса;Id— идентификатор процесса в NGINХ Unit.
В верхней части таблицы содержится список из 20 наиболее продолжительных процессов, которые были зафиксированы за анализируемую дату.
В нижней части таблицы содержится список из 5 наименее продолжительных процессов, которые были зафиксированы за анализируемую дату.
Списки отсортированы по убыванию продолжительности.
Отчёт типа graph
Пример отчёта типа graph, включающий 2 графика:
- график количества процессов NGINX Unit для запущенных приложений с усреднением за один час;
- график медианной продолжительности исполнения процессов.
Формат значений продолжительности исполнения процессов NGINX Unit на графике имеет вид:
H:MM:SS, где: H — часы, MM — минуты, SS — секунды.
Авторы
© 2024-2025 andrey-tech
Лицензия
Данная библиотека распространяется на условиях лицензии MIT.


