macocci7 / php-plotter2d
A PHP Library to plot graphs and figures on a xy(-two-dimensional)-plane.
Installs: 112
Dependents: 3
Suggesters: 0
Security: 0
Stars: 0
Watchers: 1
Forks: 0
Open Issues: 1
pkg:composer/macocci7/php-plotter2d
Requires
- php: >=8.1
- intervention/image: ^3.10
- nette/neon: ^3.4
Requires (Dev)
- php-parallel-lint/php-parallel-lint: 1.4
- phpstan/phpstan: ^2.1
- phpunit/phpunit: ^10.5
- squizlabs/php_codesniffer: ^3.11
README
A PHP Library to plot graphs and figures on a xy(-two-dimensional)-plane.
1. Features
PHP-Plotter2d provides basic features to plot graphs and figures on a xy(-two-dimensional)-plane.
1.1. Canvas
You can draw figures freely on the canvas, such as:
Pixels, Lines, Boxes, Circles, Ellipses, Polygons and Bezier Curves.
You can also put Text or Fill the canvas with a specific color.
You can save the Canvas to a file.

1.2. Plotarea
You can put figures within the Plotarea by just specifying the coordinates on the xy-plane without having to consider the pixel coordinates on the image.
Transformer automatically maps the coordinates on the xy-plane to pixel coordinates on the image.
Plotarea is automatically placed on the Canvas.
You can adjust the position and the size of Plotarea on the Canvas.

1.3. Transformer
You can use only Transformer separately from Canvas and Plotarea.
use Macocci7\PhpPlotter2d\Transformer;

$transformer = new Transformer(
    viewport: ['x' => [-1, 4], 'y' => [-2, 3]],
    plotarea: [
        'width' => 400,
        'height' => 400,
    ],
);

$points = $transformer->getCoords([
    [-0.5, -1.2],
    [1.3, 0.6],
    [3.4, 2.8],
]);
2. Contents
3. Requirements
-
PHP 8.1 or later
-
Imagick PHP Extension
Check with commands:
php -i | grep imagick -
Composer
4. Installation
composer require macocci7/php-plotter2d
5. Usage
5.1. Handling Canvas
To draw figures on the Canvas, create an instance of Canvas at first.
Use Plotter::make() method to get an instance of Canvas.
Pass the width and height of the Canvas in the canvasSize parameter.
<?php

require_once __DIR__ . '/../vendor/autoload.php';

use Macocci7\PhpPlotter2d\Plotter;

$canvas = Plotter::make(
    canvasSize: ['width' => 800, 'height' => 400],  // required
);
Now, you can draw figures on the Canvas with draw* methods.
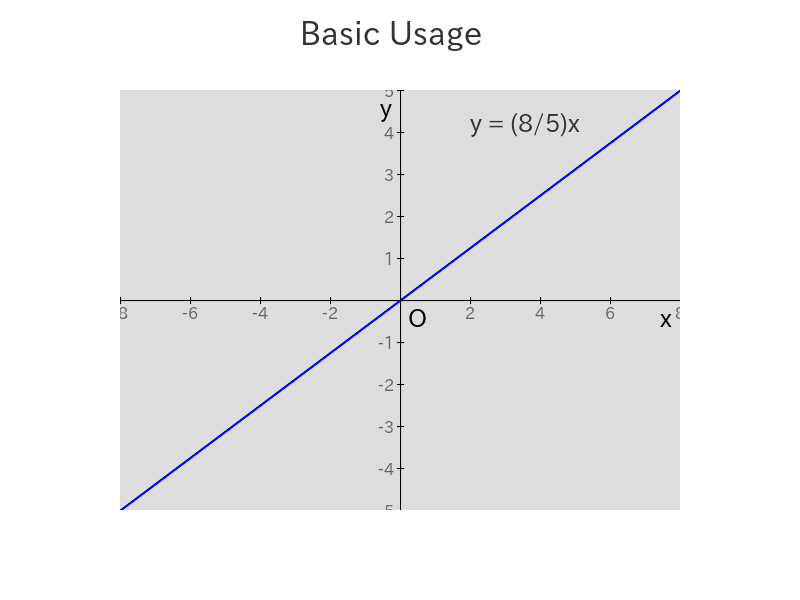
$canvas->drawText('Basic Usage', 300, 20, 32, valign: 'top');
You can save the image into a file with save method.
$canvas
    ->drawText('Handling Canvas', 300, 20, 32, valign: 'top')
    ->save('img/HandlingCanvas.png');
Available methods to draw on the Canvas:
- fill()
- drawPixel()
- drawLine()
- drawBox()
- drawCircle()
- drawEllipse()
- drawArc()
- drawEllipticalArc()
- drawPolygon()
- drawBezier()
- drawText()
fill()
fills the Canvas with the specified color.
| params | type | required | default | exampl | description |
|---|---|---|---|---|---|
| $x | int | required | 10 | horizontal position (in pixel) | |
| $y | int | required | 20 | vertical position (in pixel) | |
| $color | string | required | '#0000ff' | color code (in hex format) |
drawPixel()
draws a pixel.
| params | type | required | default | exampl | description |
|---|---|---|---|---|---|
| $x | int | required | 10 | horizontal position (in pixel) | |
| $y | int | required | 20 | vertical position (in pixel) | |
| $color | string | required | '#0000ff' | color code (in hex format) |
drawLine()
draws a line.
| params | type | required | default | exampl | description |
|---|---|---|---|---|---|
| $x1 | int | required | 10 | horizontal position of starting point (in pixel) | |
| $y1 | int | required | 20 | vertical position of starting point (in pixel) | |
| $x2 | int | required | 30 | horizontal position of end point (in pixel) | |
| $y2 | int | required | 40 | vertical position of end point (in pixel) | |
| $width | int | 1 | 2 | vertical position (in pixel) | |
| $color | string | '#000000' | '#0000ff' | color code (in hex format) | |
| $dash | int[] | [] | [8, 4, 2, 4] | dash pattern(solid and blank) |
drawBox()
draws a box.
Note:
nullvalue for a color code results in transparent.
| params | type | required | default | exampl | description |
|---|---|---|---|---|---|
| $x1 | int | required | 10 | horizontal position of starting point (in pixel) | |
| $y1 | int | required | 20 | vertical position of starting point (in pixel) | |
| $x2 | int | required | 30 | horizontal position of end point (in pixel) | |
| $y2 | int | required | 40 | vertical position of end point (in pixel) | |
| $backgroundColor | string|null | null |
'#ccffff' | background color (in hex format) | |
| $borderWidth | int | 1 | 2 | border width (in pixel) | |
| $borderColor | string|null | '#000000' | '#0000ff' | border color (in hex format) | |
| $dash | int[] | [] | [8, 4, 2, 4] | dash pattern (solid and blank) |
drawCircle()
draws a circle.
Note:
nullvalue for a color code results in transparent.
| params | type | required | default | exampl | description |
|---|---|---|---|---|---|
| $x | int | required | 60 | horizontal position of the center (in pixel) | |
| $y | int | required | 50 | vertical position of the center (in pixel) | |
| $radius | int | required | 40 | radius of the circle (in pixel) | |
| $backgroundColor | string|null | null |
'#ccffff' | background color (in hex format) | |
| $borderWidth | int | 1 | 2 | border width (in pixel) | |
| $borderColor | string|null | '#000000' | '#0000ff' | border color (in hex format) |
drawEllipse()
draws an ellipse.
Note:
nullvalue for a color code results in transparent.
| params | type | required | default | exampl | description |
|---|---|---|---|---|---|
| $x | int | required | 60 | horizontal position of the center (in pixel) | |
| $y | int | required | 50 | vertical position of the center (in pixel) | |
| $width | int | required | 40 | width of the ellipse (in pixel) | |
| $height | int | required | 30 | height of the ellipse (in pixel) | |
| $backgroundColor | string|null | null |
'#ccffff' | background color (in hex format) | |
| $borderWidth | int | 1 | 2 | border width (in pixel) | |
| $borderColor | string|null | '#000000' | '#0000ff' | border color (in hex format) |
drawArc()
draws an arc.
Note:
nullvalue for a color code results in transparent.
| params | type | required | default | exampl | description |
|---|---|---|---|---|---|
| $x | int | required | 60 | horizontal position of the center (in pixel) | |
| $y | int | required | 50 | vertical position of the center (in pixel) | |
| $radius | int | required | 40 | radius of the circle (in pixel) | |
| $degrees1 | int|float | required | 32.1 | starting angle (in degrees) | |
| $degrees2 | int|float | required | -23.4 | terminal angle (in degrees) | |
| $backgroundColor | string|null | null |
'#ccffff' | background color (in hex format) | |
| $borderWidth | int | 1 | 2 | border width (in pixel) | |
| $borderColor | string|null | '#000000' | '#0000ff' | border color (in hex format) | |
| $withSides | bool | false |
true |
whether to draw sides |
drawEllipticalArc()
draws an elliptical arc.
Note: If a non-null background color is specified, or
trueis specified for thewithSideargument, an elliptical sector connecting the center of the ellipse and the elliptical arc will be drawn.
Note:
nullvalue for a color code results in transparent.
| params | type | required | default | exampl | description |
|---|---|---|---|---|---|
| $x | int | required | 60 | horizontal position of the center (in pixel) | |
| $y | int | required | 50 | vertical position of the center (in pixel) | |
| $width | int | required | 80 | width of the ellipse (in pixel) | |
| $height | int | required | 120 | height of the ellipse (in pixel) | |
| $degrees1 | int|float | required | 32.1 | starting angle (in degrees) | |
| $degrees2 | int|float | required | -23.4 | terminal angle (in degrees) | |
| $backgroundColor | string|null | null |
'#ccffff' | background color (in hex format) | |
| $borderWidth | int | 1 | 2 | border width (in pixel) | |
| $borderColor | string|null | '#000000' | '#0000ff' | border color (in hex format) | |
| $withSides | bool | false |
true |
whether to draw sides |
drawPolygon()
draws a polygon.
Note:
nullvalue for a color code results in transparent.
| params | type | required | default | exampl | description |
|---|---|---|---|---|---|
| $points | array<int, int[]> | required | [[1, 2], [3, 4]] | positions of the points (in pixel) | |
| $backgroundColor | string|null | null |
'#ccffff' | background color (in hex format) | |
| $borderWidth | int | 1 | 2 | border width (in pixel) | |
| $borderColor | string|null | '#000000' | '#0000ff' | border color (in hex format) |
drawBezier()
draws a Bezier curve.
Note:
nullvalue for a color code results in transparent.
| params | type | required | default | exampl | description |
|---|---|---|---|---|---|
| $points | array<int, int[]> | required | [[1, 2], [3, 4]] | positions of the points (in pixel) | |
| $backgroundColor | string|null | null |
'#ccffff' | background color (in hex format) | |
| $borderWidth | int | 1 | 2 | border width (in pixel) | |
| $borderColor | string|null | '#000000' | '#0000ff' | border color (in hex format) |
drawText()
draws text.
| params | type | required | default | exampl | description |
|---|---|---|---|---|---|
| $text | string | required | 'Title' | text to draw | |
| $x | int | required | 40 | horizontal position (in pixel) | |
| $y | int | required | 40 | vertical position (in pixel) | |
| $fontSize | int | 16 | 32 | font size (in pixel) | |
| $fontPath | string | './fonts/myfont.ttf' | 32 | font path (true type) | |
| $fontColor | string | '#000000 | '#009900' | font color (in hex format) | |
| $align | string | 'left' | 'center' | text align | |
| $valign | string | 'bottom' | 'middle' | text valign | |
| $angle | int\float | 0 | -23.4 | degrees to rotate (counterclockwise) | |
| $offsetX | int\float | 0 | 3.5 | x-offset from left edge (after rotation) | |
| $offsetY | int\float | 0 | -1.5 | y-offset from top edge (after rotation) | |
| $rotateAlign | string | 'center' | 'left' | align (after rotation) | |
| $rotateValign | string | 'middle' | 'top' | valign (after rotation) |
5.2. Handling Plotarea
To plot figures within the Plotarea, ceate an instance of Canvas with the parameters of viewport and plotarea.
viewport is the definition of the visible area of the xy-plane, which consists of arrays of x and y ranges.
plotarea has five attributes: offset, width, height, backgroundColor and placeAutomatically.
<?php

require_once __DIR__ . '/../vendor/autoload.php';

use Macocci7\PhpPlotter2d\Plotter;

$canvas = Plotter::make(
    canvasSize: [
        'width' => 800,     // required
        'height' => 400,    // required
    ],
    viewport: [
        'x' => [-5, 5],     // -5 <= x <= 5
        'y' => [-5, 5],     // -5 <= y <= 5
    ],
    plotarea: [
        // 20pix from left edge, 30pix from top edge
        // default=(10% of the canvas)
        'offset' => [20, 30],
        'width' => 640, // in pix, default=(80% of the canvas)
        'height' => 360 // in pix, default=(80% of the canvas)
        'backgroundColor' => '#dddddd', // defautl='#ffffff'
        'placeAutomatically' => false, // default=true
    ],
    backgroundColor: '#0000cc',  // optional, default='#ffffff'
);
Now, you can plot figures within the Plotarea by using plot* methods with coordinates on the xy-plane.
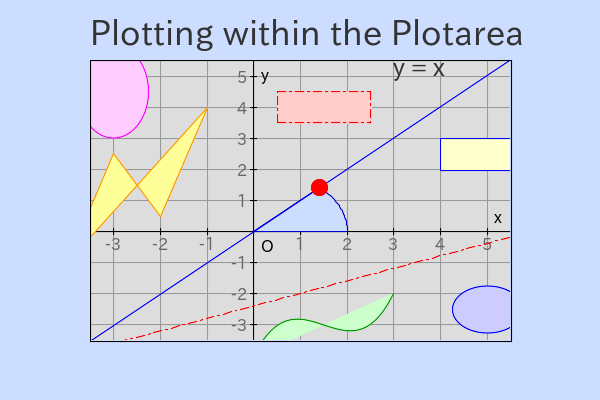
// boxrange: (-3.5, 4.2) - (2.5, 2.3)
// backgroundColor: '#ffff99'
// borderWidth: 1 (pix)
// borderColor: '#0000ff'
$canvas
    ->plotBox(-3.5, 4.2, 2.5, 2.3, '#ffff99', 1, '#0000ff')
    ->save('img/HandlingPlotarea.png');
When you set $plotarea['placeAutomatically'] as false, you need to use placePlotarea() method to place Plotarea on the Canvas after using plot* methods.
This is expected to avoid slowdowns when using the plot* methods frequently, and unexpected results when making the background of Plotarea transparent.
$canvas
    ->plotBox(-3.5, 4.2, 2.5, 2.3, '#ffff99', 1, '#0000ff')
    ->placePlotarea()
    ->save('img/HandlingPlotarea.png');
Available plot* methods to plot figures within the Plotarea:
- plotFill()
- plotPixel()
- plotLine()
- plotBox()
- plotCircle()
- plotPerfectCircle()
- plotEllipse()
- plotArc()
- plotPolygon()
- plotBezier()
- plotText()
- plotGridHorizon()
- plotGridVertical()
- plotGridValuesX()
- plotGridValuesY()
- plotAxisX()
- plotAxisY()
- plotAxisLabelO()
- plotAxisLabelX()
- plotAxisLabelY()
- plotScaleX()
- plotScaleY()
plotFill()
fills the Plotarea with the specified color.
| parmas | type | required | default | example | description |
|---|---|---|---|---|---|
| $x | int|float | required | -2.4 | x-coordinate | |
| $y | int|float | required | 3.2 | y-coordinate | |
| $color | string | required | '#cccccc' | color code (in hex format) |
plotPixel()
plots a pixel within the Plotarea.
| parmas | type | required | default | example | description |
|---|---|---|---|---|---|
| $x | int|float | required | -3.5 | x-coordinate | |
| $y | int|float | required | 4.5 | y-coordinate | |
| $color | string | required | '#ff0000' | color code (in hex format) |
plotLine()
plots a line within the Plotarea.
| parmas | type | required | default | example | description |
|---|---|---|---|---|---|
| $x1 | int|float | required | -6.2 | x-coordinate of the starting point | |
| $y1 | int|float | required | -7.4 | y-coordinate of the starting point | |
| $x2 | int|float | required | 8.3 | x-coordinate of the end point | |
| $y2 | int|float | required | 6.4 | y-coordinate of the end point | |
| $width | int | 1 | 2 | width (in pixel) | |
| $color | string | '#000000' | '#009900' | color code (in hex format) | |
| $dash | int[] | [] | [8, 4, 2, 4] | dash pattern (solid and blank) |
plotBox()
polots a box within the Plotarea.
Note:
nullvalue for a color code results in transparent.
| parmas | type | required | default | example | description |
|---|---|---|---|---|---|
| $x1 | int|float | required | -3.5 | x-coordinate of the starting point | |
| $y1 | int|float | required | 4.5 | y-coordinate of the starting point | |
| $x2 | int|float | required | -0.5 | x-coordinate of the end point | |
| $y2 | int|float | required | 2.5 | y-coordinate of the end point | |
| $backgroundColor | string|null | null |
'#cccccc' | background color (in hex format) | |
| $borderWidth | int | 1 | 2 | border width (in pixel) | |
| $borderColor | string|null | '#000000' | '#0000ff' | border color (in hex format) | |
| $dash | int[] | [] | [8, 4, 2, 4] | dash pattern (solid and blank) |
plotCircle()
plots a ciele within the Plotarea.
Note: If the
viewport aspect ratioand theplotarea aspect ratioare not equal,plotCircle()draws an ellipse.Use plotPerfectCircle() if you want to plot a perfect circle regardless of transformation rate.
Note:
nullvalue for a color code results in transparent.
| parmas | type | required | default | example | description |
|---|---|---|---|---|---|
| $x | int|float | required | -3.5 | x-coordinate of the center | |
| $y | int|float | required | 4.5 | y-coordinate of the center | |
| $radius | int|float | required | 2.5 | radius | |
| $backgroundColor | string|null | null |
'#cccccc' | background color (in hex format) | |
| $borderWidth | int | 1 | 2 | border width (in pixel) | |
| $borderColor | string|null | '#000000' | '#0000ff' | border color (in hex format) |
plotPerfectCircle()
plots a perfect ciele within the Plotarea regardless of transformation rate.
Note: Specify the radius in pix.
Note:
nullvalue for a color code results in transparent.
| parmas | type | required | default | example | description |
|---|---|---|---|---|---|
| $x | int|float | required | -3.5 | x-coordinate of the center | |
| $y | int|float | required | 4.5 | y-coordinate of the center | |
| $radius | int | required | 2 | radius (in pix) | |
| $backgroundColor | string|null | null |
'#cccccc' | background color (in hex format) | |
| $borderWidth | int | 1 | 2 | border width (in pixel) | |
| $borderColor | string|null | '#000000' | '#0000ff' | border color (in hex format) |
plotEllipse()
plots an ellipse within the Plotarea.
Note:
nullvalue for a color code results in transparent.
| parmas | type | required | default | example | description |
|---|---|---|---|---|---|
| $x | int|float | required | -3.5 | x-coordinate of the center | |
| $y | int|float | required | 4.5 | y-coordinate of the center | |
| $width | int|float | required | 2.5 | width | |
| $height | int|float | required | 5.5 | height | |
| $backgroundColor | string|null | null |
'#cccccc' | background color (in hex format) | |
| $borderWidth | int | 1 | 2 | border width (in pixel) | |
| $borderColor | string|null | '#000000' | '#0000ff' | border color (in hex format) |
plotArc()
plots an arc within the Plotarea.
Note: If the
viewport aspect ratioand theplotarea aspect ratioare not equal,plotArc()draws an elliptical arc.
Note:
nullvalue for a color code results in transparent.
| parmas | type | required | default | example | description |
|---|---|---|---|---|---|
| $x | int|float | required | -3.5 | x-coordinate of the center | |
| $y | int|float | required | 4.5 | y-coordinate of the center | |
| $radius | int|float | required | 2.5 | radius | |
| $degrees1 | int|float | required | 23.4 | starting angle (in degrees) | |
| $degrees2 | int|float | required | -32.1 | terminal angle (in degrees) | |
| $backgroundColor | string|null | null |
'#cccccc' | background color (in hex format) | |
| $borderWidth | int | 1 | 2 | border width (in pixel) | |
| $borderColor | string|null | '#000000' | '#0000ff' | border color (in hex format) | |
| $widthSides | bool | false |
true |
whether to draw sides |
plotPolygon()
plots a polygon within the Plotarea.
Note:
nullvalue for a color code results in transparent.
| parmas | type | required | default | example | description |
|---|---|---|---|---|---|
| $points | list<int[]> | required | [[-3, -4], [-2, 1]] | coorinates of the points | |
| $backgroundColor | string|null | null |
'#cccccc' | background color (in hex format) | |
| $borderWidth | int | 1 | 2 | border width (in pixel) | |
| $borderColor | string|null | '#000000' | '#0000ff' | border color (in hex format) |
plotBezier()
plots a Bezier curve within the Plotarea.
Note:
nullvalue for a color code results in transparent.
| parmas | type | required | default | example | description |
|---|---|---|---|---|---|
| $points | list<int[]> | required | [[-3, -4], [-2, 1]] | coorinates of the points | |
| $backgroundColor | string|null | null |
'#cccccc' | background color (in hex format) | |
| $borderWidth | int | 1 | 2 | border width (in pixel) | |
| $borderColor | string|null | '#000000' | '#0000ff' | border color (in hex format) |
plotText()
plots text within the Plotarea.
| parmas | type | required | default | example | description |
|---|---|---|---|---|---|
| $text | string | required | 'Title' | text to plot | |
| $x | int|string | required | -4.5 | x-coordinate | |
| $y | int|string | required | 4.5 | y-coordinate | |
| $fontSize | int | 16 | 32 | font size (in pix) | |
| $fontPath | string | '' | './fonts/myfont.ttf' | font path (true type) | |
| $fontColor | string | '#000000' | '#666666' | font color (in hex format) | |
| $align | string | 'left' | 'center' | hirizontal align | |
| $valign | string | 'bottom' | 'middle' | vertical align | |
| $angle | int|float | 0 | -23.4 | degrees to rotate (counterclockwise) | |
| $offsetX | int|float | 0 | 3.5 | x-offset from left edge (after rotation) | |
| $offsetY | int|float | 0 | -1.5 | y-offset from top edge (after rotation) | |
| $rotateAlign | string | 'center' | 'left' | align (after rotation) | |
| $rotateValign | string | 'middle' | 'top' | valign (after rotation) |
plotGridHorizon()
plots horizontal grids within the Plotarea.
Note: If
0is passed to$interval,$intervalwill be set to the automatically calculated optimal value.
| parmas | type | required | default | example | description |
|---|---|---|---|---|---|
| $interval | int|float | 0 | 2.5 | interval between grids (in y direction) | |
| $width | int | 1 | 2 | width (in pixel) | |
| $color | string | '#999999' | '#ff99ff' | color code (in hex format) |
plotGridVertical()
plots vertical grids within the Plotarea.
Note: If
0is passed to$interval,$intervalwill be set to the automatically calculated optimal value.
| parmas | type | required | default | example | description |
|---|---|---|---|---|---|
| $interval | int|float | 0 | 2.5 | interval between grids (in x direction) | |
| $width | int | 1 | 2 | width (in pixel) | |
| $color | string | '#999999' | '#ff99ff' | color code (in hex format) |
plotGridValuesX()
plots grid values on the x-axis within the Plotarea.
Note: If
0is passed to$interval,$intervalwill be set to the automatically calculated optimal value.
| parmas | type | required | default | example | description |
|---|---|---|---|---|---|
| $interval | int|float | 0 | 2.5 | interval between grids (in x direction) | |
| $size | int | 16 | 2 | width (in pixel) | |
| $color | string | '#666666' | '#3333cc' | color code (in hex format) | |
| $fontPath | string | '' | './fonts/myfont.ttf' | font path (true type) | |
| $position | string | 'lower' | 'upper' | relative position to the x-axis | |
| $except | int[] | [0] | [-5, -3, -1, 0, 1, 3, 5] | list of values to exclude |
plotGridValuesY()
plots grid values on the y-axis within the Plotarea.
Note: If
0is passed to$interval,$intervalwill be set to the automatically calculated optimal value.
| parmas | type | required | default | example | description |
|---|---|---|---|---|---|
| $interval | int|float | 0 | 2.5 | interval between grids (in y direction) | |
| $size | int | 16 | 2 | width (in pixel) | |
| $color | string | '#666666' | '#3333cc' | color code (in hex format) | |
| $fontPath | string | '' | './fonts/myfont.ttf' | font path (true type) | |
| $position | string | 'lower' | 'upper' | relative position to the x-axis | |
| $except | int[] | [0] | [-5, -3, -1, 0, 1, 3, 5] | list of values to exclude |
plotAxisX()
plots x-axis with within the Plotarea.
| parmas | type | required | default | example | description |
|---|---|---|---|---|---|
| $width | int | 1 | 2 | width (in pix) | |
| $color | string | '#000000' | '#000099' | color code (in hex format) |
plotAxisY()
plots x-axis with within the Plotarea.
| parmas | type | required | default | example | description |
|---|---|---|---|---|---|
| $width | int | 1 | 2 | width (in pix) | |
| $color | string | '#000000' | '#000099' | color code (in hex format) |
plotAxisLabelO()
plots the origin label within the Plotarea.
| parmas | type | required | default | example | description |
|---|---|---|---|---|---|
| $label | string | 'O' | 'Z' | width (in pix) | |
| $size | int | 16 | 24 | font size (in pix) | |
| $color | string | '#000000' | '#000099' | color code (in hex format) | |
| $quadrant | int | 3 | 4 | number of quadrant to plot the label for | |
| $fontPath | string | '' | './fonts/myfont.ttf' | font path (true type) |
plotAxisLabelX()
plots the x-axis label within the Plotarea.
| parmas | type | required | default | example | description |
|---|---|---|---|---|---|
| $label | string | 'x' | 'A' | width (in pix) | |
| $size | int | 16 | 24 | font size (in pix) | |
| $color | string | '#000000' | '#000099' | color code (in hex format) | |
| $position | string | 'lower' | 'upper' | relative position to the x-axis | |
| $fontPath | string | '' | './fonts/myfont.ttf' | font path (true type) |
plotAxisLabelY()
plots the y-axis label within the Plotarea.
| parmas | type | required | default | example | description |
|---|---|---|---|---|---|
| $label | string | 'y' | 'B' | width (in pix) | |
| $size | int | 16 | 24 | font size (in pix) | |
| $color | string | '#000000' | '#000099' | color code (in hex format) | |
| $position | string | 'left' | 'right' | relative position to the y-axis | |
| $fontPath | string | '' | './fonts/myfont.ttf' | font path (true type) |
plotScaleX()
plots the x-axis scale within the Plotarea.
Note: If
0is passed to$interval,$intervalwill be set to the automatically calculated optimal value.
| parmas | type | required | default | example | description |
|---|---|---|---|---|---|
| $interval | int|float | 0 | 2.0 | interval between scale lines. | |
| $width | int | 1 | 2 | width (in pix) | |
| $length | int | 6 | 10 | scale line length (in pix) | |
| $color | string | '#000000' | '#990000' | color code (in hex format) |
plotScaleY()
plots the y-axis scale within the Plotarea.
Note: If
0is passed to$interval,$intervalwill be set to the automatically calculated optimal value.
| parmas | type | required | default | example | description |
|---|---|---|---|---|---|
| $interval | int|float | 0 | 2.0 | interval between scale lines. | |
| $width | int | 1 | 2 | width (in pix) | |
| $length | int | 6 | 10 | scale line length (in pix) | |
| $color | string | '#000000' | '#990000' | color code (in hex format) |
5.3. Handling Transformer
To use Transformer, create an instance of Transformer at first.
use Macocci7\PhpPlotter2d\Transformer;

$transformer = new Transformer(
    viewport: ['x' => [-1, 4], 'y' => [-2, 3]],
    plotarea: [
        'width' => 400,
        'height' => 400,
    ],
);
Now, you can use get* methods.
$x = -0.5;
$y = 2.8;
$coord = $transformer->getCoord($x, $y);
echo "({$x}, {$y}) -> ({$coord['x']}, {$coord['y']})" . PHP_EOL;
This code results in:
(-0.5, 2.8) -> (40, 16)
Available methods:
getRateX()
returns the transformation rate of x,
which is defined as:
(width of plogarea) / (range of x)
getRateY()
returns the transformation rate of y,
which is defined as:
(height of plotarea) / (range of y)
getCoord()
returns the transformed coordinate.
| params | type | required | default | example | description |
|---|---|---|---|---|---|
| $x | int|float | required | -0.5 | x-coordinate on the xy-plane. | |
| $y | int|float | required | 2.8 | y-coordinate on the xy-plane. |
For example,
$transformer->getCoord(-0.5, 2.8);
returns
['x' => 40, 'y' => 16]
getCoords()
returns multiple transformed coordinates as an arrray.
| params | type | required | default | example | description |
|---|---|---|---|---|---|
| $points | array<int, array<int, int|float>> | required | (see below) | coordinates |
For example,
$transformer->getCoords([
    [-0.5, -1.2],
    [1.3, 0.6],
    [3.4, 2.8],
]);
returns
[
    0 => [40, 336],
    1 => [184, 192],
    2 => [352, 16],
]
getSpanX()
returns the transformed span of the x-direction component.
| params | type | required | default | example | description |
|---|---|---|---|---|---|
| $span | int|float | required | 0.25 | span of the x-direction component |
getSpanY()
returns the transformed span of the y-direction component.
| params | type | required | default | example | description |
|---|---|---|---|---|---|
| $span | int|float | required | 0.25 | span of the y-direction component |
6. Examples
-
BasicUsage.php >> results in:
-
DrawOnCanvas.php >> results in:
-
PlotWithinPlotarea.php >> results in:
-
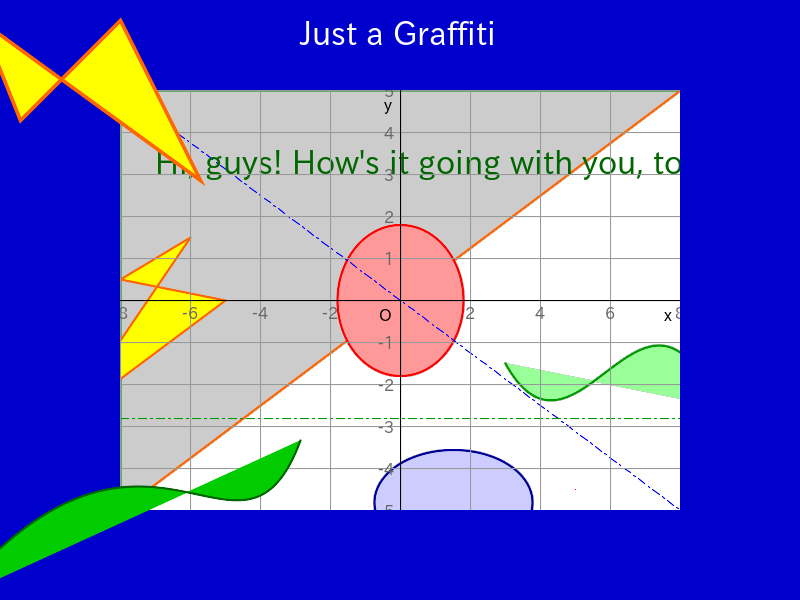
Graffiti.php >> results in:
-
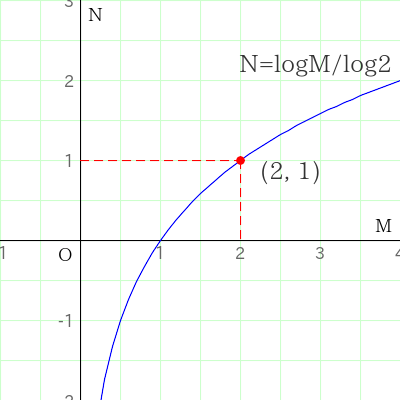
GraphLogCurve.php >> results in:
-
UseTransformer.php >> results in:
(-0.5, 2.8) -> (40, 16)


7. LICENSE
Copyright 2024-2025 macocci7